What Is a Size Chart and Why Do You Need One?
Picture a Monday morning at a $20M contemporary womenswear brand. The customer service lead opens the returns queue and sees the same pattern as last week: 38 percent of the returns on the new spring dress cite “runs small.” The production manager pulls the tech pack and finds the bust point of measure at size M is 89 cm, but the storefront size chart still shows the old 91 cm value from the fall collection. Two numbers, two teams, one product. That gap is what a real size chart is designed to close.
Get sizing wrong and the cost shows up fast: returns, exchanges, cart abandonment, and customer service hours spent on fit complaints. It is worse online where nobody can try the garment on. This guide covers what a size chart includes, the difference between the internal and customer-facing versions, and how to build one step by step, with both inches and centimeters and international conversions. An effective size chart reduces returns, improves customer satisfaction, and supports how a brand builds wholesale credibility.
What is a size chart, in one paragraph?
A size chart is a reference table that links each size label (XS, S, M, 32, 40) to a defined set of body measurements or garment measurements, expressed in inches and centimeters and often cross-referenced against US, UK, EU, and AU conventions. It exists in two forms inside an apparel business: an internal grading spec that lives in PLM and drives the tech pack, and a customer-facing version that lives on the product page and the printed hangtag. Both should be generated from the same source of truth. When they drift apart, fit consistency drifts with them.
From the go-lives I have run this year, the pattern is consistent: brands that keep fit consistent are the ones that treat sizing as product data defined once and applied across every style, season, and channel. Brands that keep sizing in a Google Sheet per collection re-invent their own grade rules every drop, and their return rates show it.
What ready-to-use apparel size charts can you start from?
Start from these industry-standard charts, then adjust to your own fit and target customer. Sizing varies by brand and region, so treat any published chart as a baseline and validate it against real bodies across your full size range before you publish it. All measurements are body measurements (not garment measurements), shown in inches and centimeters.
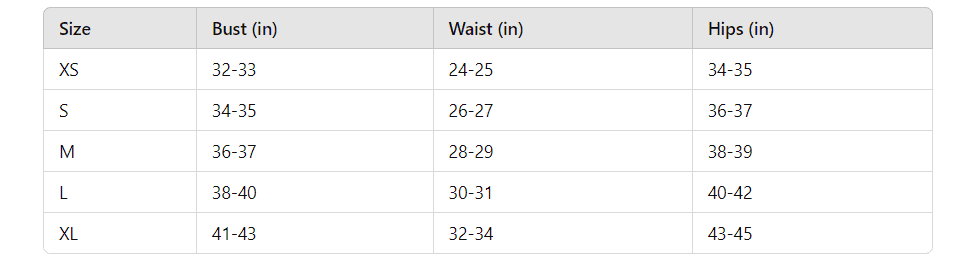
Women’s tops and dresses (body measurements)
| Size | US | Bust (in) | Waist (in) | Hip (in) | Bust (cm) | Waist (cm) | Hip (cm) |
|---|---|---|---|---|---|---|---|
| XS | 0-2 | 31-32 | 24-25 | 34-35 | 79-81 | 61-64 | 86-89 |
| S | 4-6 | 33-34 | 26-27 | 36-37 | 84-86 | 66-69 | 91-94 |
| M | 8-10 | 35-36 | 28-29 | 38-39 | 89-91 | 71-74 | 97-99 |
| L | 12-14 | 37-39 | 30-32 | 40-42 | 94-99 | 76-81 | 102-107 |
| XL | 16-18 | 40-42 | 33-35 | 43-45 | 102-107 | 84-89 | 109-114 |
Women’s bottoms (body measurements)
| Size | US | Waist (in) | Hip (in) | Waist (cm) | Hip (cm) |
|---|---|---|---|---|---|
| XS | 0-2 | 24-25 | 34-35 | 61-64 | 86-89 |
| S | 4-6 | 26-27 | 36-37 | 66-69 | 91-94 |
| M | 8-10 | 28-29 | 38-39 | 71-74 | 97-99 |
| L | 12-14 | 30-32 | 40-42 | 76-81 | 102-107 |
| XL | 16-18 | 33-35 | 43-45 | 84-89 | 109-114 |
Men’s tops (body measurements)
| Size | Chest (in) | Waist (in) | Neck (in) | Sleeve (in) | Chest (cm) | Waist (cm) |
|---|---|---|---|---|---|---|
| S | 35-37 | 29-31 | 14-14.5 | 32-33 | 89-94 | 74-79 |
| M | 38-40 | 32-34 | 15-15.5 | 33-34 | 97-102 | 81-86 |
| L | 41-43 | 35-37 | 16-16.5 | 34-35 | 104-109 | 89-94 |
| XL | 44-46 | 38-40 | 17-17.5 | 35-36 | 112-117 | 97-102 |
| XXL | 47-49 | 41-43 | 18-18.5 | 36-37 | 119-124 | 104-109 |
Men’s bottoms (body measurements)
| Size | Waist (in) | Hip (in) | Inseam (in) | Waist (cm) | Hip (cm) |
|---|---|---|---|---|---|
| S | 29-31 | 35-37 | 30-32 | 74-79 | 89-94 |
| M | 32-34 | 38-40 | 30-32 | 81-86 | 97-102 |
| L | 35-37 | 41-43 | 32-34 | 89-94 | 104-109 |
| XL | 38-40 | 44-46 | 32-34 | 97-102 | 112-117 |
| XXL | 41-43 | 47-49 | 32-34 | 104-109 | 119-124 |
International size conversion (women’s)
| US | UK | EU | AU | Alpha |
|---|---|---|---|---|
| 0 | 4 | 32 | 4 | XS |
| 2 | 6 | 34 | 6 | XS |
| 4 | 8 | 36 | 8 | S |
| 6 | 10 | 38 | 10 | S/M |
| 8 | 12 | 40 | 12 | M |
| 10 | 14 | 42 | 14 | M/L |
| 12 | 16 | 44 | 16 | L |
| 14 | 18 | 46 | 18 | L/XL |
| 16 | 20 | 48 | 20 | XL |
International size conversion (men’s tops)
| Alpha | Chest (in) | US/UK | EU |
|---|---|---|---|
| S | 35-37 | 34-36 | 44-46 |
| M | 38-40 | 38-40 | 48-50 |
| L | 41-43 | 41-43 | 52 |
| XL | 44-46 | 44-46 | 54 |
| XXL | 47-49 | 47-49 | 56 |
How do you measure the body correctly?
- Bust / chest: measure around the fullest part, keeping the tape level and snug but not tight.
- Waist: measure around the narrowest part of the natural waistline.
- Hip: measure around the fullest part of the hips and seat.
- Inseam: measure from the crotch seam down to the bottom of the leg on a well-fitting pair of trousers.
- Sleeve (men’s): measure from the center back of the neck, across the shoulder, and down to the wrist.
- Neck (men’s): measure around the base of the neck where a collar sits.
These charts are a baseline, not your brand’s truth. Brands that keep fit consistent treat sizing as product data defined once and applied across every style, season, and channel, with the underlying spec living in PLM so designers, factories, and storefronts all work from the same numbers. When that spec is scattered across a spreadsheet per collection instead, it is the first of the 6 Breakpoints of apparel operations, where product data starts fragmenting across teams and tools.
What does a size chart actually contain?
A size chart is the reference tool the fashion industry uses to give customers detailed measurements so they can pick the right size for clothing and accessories. In practice it is a list of every point of measure on the body relevant to the garment type, from hips and waist to chest, bust, inseam, sleeve, and neck, mapped to size labels.
The primary job of the chart is to remove guesswork at the point of purchase. Nobody wants to receive a dress that turns out to be two sizes off, especially when the return process eats a week and a shipping label. Whether you sell through a Shopify storefront, a wholesale linesheet, or a physical retail space, a clear size chart reduces confusion, improves the customer experience, and cuts returns caused by poor fit.
Why do you need a size chart for your fashion business?
Size charts do more than reduce garment returns. They enforce sizing consistency across every style you launch, which is the real prize. Here is why publishing and maintaining one matters.
How much do returns and exchanges actually cost?
Poor fit is one of the two largest drivers of returns in apparel, alongside color mismatch. On a $15M DTC brand running a 20 percent return rate at a $90 average order value, that is roughly $3M of returned merchandise a year moving back through the warehouse, each unit incurring inbound freight, inspection, restocking, and refund processing. Even a two-point reduction in fit-driven returns pays for the entire investment in a proper size chart and grade rule library. A good size chart is the cheapest lever you have to move that number.
Does a size chart really improve customer satisfaction?
Yes, when it is accurate. Nothing frustrates a shopper more than waiting five days for a piece they were excited about and finding it does not fit. A well-built chart lets customers self-select the right size with confidence, which lifts repeat purchase rates and reduces one-star reviews that mention sizing. On wholesale linesheets, the same chart doubles as a spec buyers can defend to their own end customers.
How does a size chart build brand trust?
Consistency is the trust signal. If your size M this season fits the same body as your size M last season, customers stop hedging by ordering two sizes to compare. That behavior alone is worth watching in your return data. Brands with tightly maintained grade rules see a measurable drop in bracketing, where customers order the same style in multiple sizes and return the ones that do not fit.
Where does a size chart fit into international expansion?
A brand selling into the US, UK, and EU cannot rely on a single US alpha size. A size 8 US is a 12 UK and a 40 EU. Without a published conversion, you push that decoding onto the shopper, and roughly a third of them will guess wrong. Publishing both body measurements in cm and the alpha-to-numeric conversion is the minimum bar for cross-border DTC.
What is the difference between an internal spec and a customer-facing size chart?
These are two different documents that answer to two different audiences. The internal spec is a garment measurement chart used by pattern makers, graders, and factories. It lists finished garment measurements at every point of measure, with grade rules that define how each measurement changes between sizes. It lives in the tech pack and is what the factory cuts to.
The customer-facing chart is a body measurement chart. It tells the shopper what body measurements the size is designed to fit, not what the finished garment measures. Confusing the two is the most common sizing mistake in DTC. A shopper reading a 38 inch chest on the chart expects their 38 inch chest to fit the shirt, not the shirt to measure 38 inches flat.
Both documents should be generated from the same product data record. When the pattern updates, both update. When one drifts from the other, fit complaints follow within a season.
How do you build a size chart step by step?
1. Define your target customer and fit model
Start with the body you are cutting for. A contemporary womenswear brand cutting for a 5’8” model with a 34 inch bust produces a different chart than a plus-size specialist cutting for a 5’6” model with a 44 inch bust. Pick your fit model, document their measurements, and grade out from there. Do not copy a competitor’s chart without validating it against your own pattern.
2. Choose your size system
Decide which regional convention you are anchoring on and publish conversions for every other market you sell into. The common systems are:
- US sizing
- UK sizing
- EU sizing
- Asian sizing
If you sell across regions, publish a conversion table. A US 8 is a UK 12 and an EU 40. Give the shopper the answer, do not make them Google it.
3. Include the right points of measure
Points of measure vary by garment type. The common ones are:
- Bust / chest for tops, dresses, and outerwear
- Waist for dresses, skirts, and pants
- Hip for dresses, skirts, and pants
- Inseam for pants and jeans
- Sleeve length for tops, jackets, and long-sleeved dresses
- Neck for men’s dress shirts
Measure real bodies across your intended size range before you publish. Do not extrapolate the extreme sizes from a mid-range fit model. That is where grade rule errors compound.
4. How do you make the chart readable?
Use a clean layout with one row per size and one column per measurement. Publish both inches and centimeters. Add a short “how to measure” block below the table with a diagram if you can afford it. Avoid overcrowding. If the chart cannot be read on a phone in five seconds, most of your customers will skip it.
5. Version and re-validate every season
Treat the chart as a living document tied to your PLM record. When a pattern changes, the chart updates. When a fit model changes, the chart gets re-validated. Track return reasons that mention fit and feed them back into the grade rule review at the start of every season.
What this means for an apparel operations team
The size chart is not a marketing asset. It is a product data artifact that happens to be published to the storefront. Treat it that way and the operational math changes.
For the production team, the internal grade rule library is the single reference the factory cuts to. Store it in PLM against the style record so every tech pack pulls the current version, not a snapshot from six months ago.
For the ecommerce team, the customer-facing chart should be generated from the same product data record, not maintained separately in the storefront CMS. When the pattern grows, the storefront chart follows automatically.
For the wholesale team, the linesheet chart and the DTC chart must be identical. A buyer at a department store and a Shopify customer are buying the same SKU. If they receive different specs, one of them ships back the goods.
For the customer service team, tag every return with a structured fit reason (too small, too large, too short, too long) rather than a free text field. Roll those tags up monthly and hand them to the design team as the input to the next grade review. That closes the loop between what customers experienced and what the next pattern gets cut to.
When sizing lives as product data in PLM, flows through PIM to every channel, and gets validated against real return reasons, fit consistency stops being a seasonal accident and becomes a system output. Uphance treats sizing this way by design, keeping the grade rule library on the style record and pushing the same measurements to tech packs, linesheets, and the storefront. That is the operational bar. Anything less is guessing, and guessing shows up as returns.
Frequently asked questions
Where this fits in the Uphance platform
Venkat is the Founder and CEO of Uphance and the author of the 6 Breakpoints of Apparel Operations framework. He writes about operational clarity for apparel brands as complexity grows across channels, warehouses, partners, and teams. His work focuses on why disconnected operations, not growth itself, create the chaos most mid-market brands feel between $5M and $100M in revenue, and on the operating-model patterns that decide whether scaling a brand strengthens execution or fractures it. He argues that the status quo is the real competitor in apparel software, and that the right move is fewer systems with deeper connection, not more dashboards.
Ruchit writes about product strategy for apparel operations, covering how mid-market fashion brands use connected workflows to manage product development, inventory, orders, warehouse execution, and reporting. As Head of Product at Uphance, he shapes the roadmap that ties PLM, PIM, BOM management, allocation, fulfillment, and warehouse operations into one system. His articles dig into apparel-specific operational mechanics: tech packs, spec sheets, putaway, pick-pack, landed cost, and the data plumbing that makes inventory truth possible across multiple channels and locations. He focuses on the workflow-level questions that separate generic ERPs from systems built for how apparel brands actually run.